Experiment with afterimages
top left slider
stroke weight
top right slider
number of circles
bottom left slider
maximum circle radius
bottom right slider
animation speed
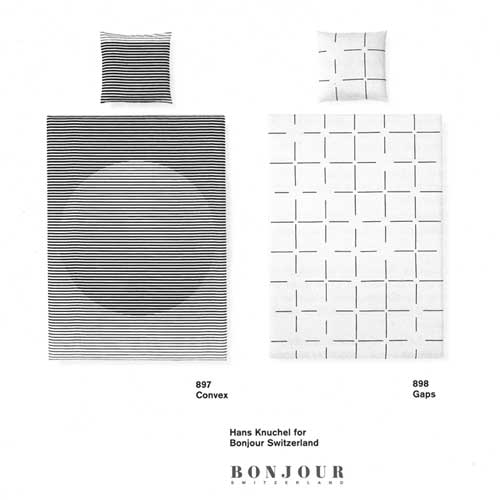
Author: Hans Knuchel
Two subjects for a bedlinen collection by well-known artists for Bonjour Switzerland
Light circular disks with phantom contours are seen over the empty spaces between the black lines. The blackness value of these disks appears to be 250% in comparison to the white background.
Over the empty spaces between the black lines there are black disks, which appear to emit only half as much light as the background.
It has been proven that this brightness illusion is not created in the retina but only after the interaction of both optic nerves in the higher regions of the visuosensory cortex (similar, for example, to the darkening and lightening at the intersection points in the classic Hering Illusion) [1]. Both the phantom edge phenomenon (Ehrenstein illusion) shown in the picture and the Kanisza figure [3] are triggered by the T-effect [2,5]: there are groups of neural cells which react to line ends (so-called terminators) and without further input create the intersections to the horizontal bar of the letter T as a precautionary measure. Each intersection could indicate the concealment of a figure in the foreground, so recognition of a potential danger must be rapid. If various T elements indicate a distinct figure (e.g. circle, square, triangle), the phantom contour is drawn in the head and the core of the figure is filled in with either the lightened or darkened background. [3].
Our dynamic presentation of the Ehrenstein illusion shows an additional phenomenon: we can subjectively influence what we want to see. If we imagine that the figures should be squares, they appear to be squares, if we relax we tend to perceive circles.
Circles are the most symmetrical shapes and make the figure the most dominant. Squares are less symmetrical and have a dominance ranking of 2 in Gestalt theory. What is also interesting here is the perception of the larger figures on the third last line.
Two seemingly concealed circles are less often seen than the horizontal rectangle. Our visual intelligence avoids unnecessary complexity. As soon as the dimensions of a gap are not substantially larger than the thickness of the lines a struggle commences between the T-effect and the most dominant object. The result is an oval. The gaps in the classic Ehrenstein illusion are very frequently complemented with coloured strokes in connection with research into the neon effect. [4] (see also several pictures in the Appendix to Spot 05). The T-effect can also be created when there is an abrupt change of colour. Under certain circumstances, the phantom figure becomes the background to the neon-effect.