Experiment with the Arc-Effect
Top-Slider
number of stripes and effect strength
Bottom-Slider
randomize the order of stripes
Button C1
swap bue and white
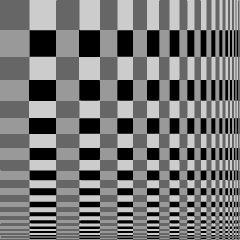
Experiment with the curve effect, 3D illusion and colour illusions and think about their causes. Learn more about these different visual phenomena.
The following miniapp shows a quarter of the picture with an increased number of stripes and allows you to find some of the causes of the various effects.
Experiment with the Arc-Effect
Top-Slider
number of stripes and effect strength
Bottom-Slider
randomize the order of stripes
Buttons C1..C4
repeatedly click to change colors 1 to 4
If you choose white, blue, red and yellow, you produce the following picture, reminiscent of Victor Vasarely:
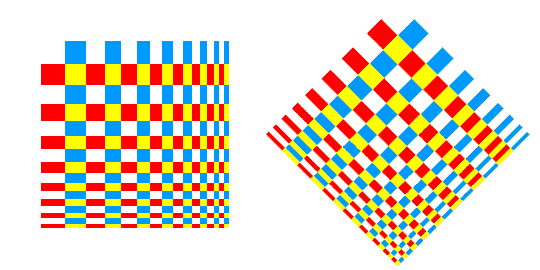
The small colour elements seem to lie on curves. This illusion is reinforced in the picture on the right. If you screw your eyes up, white and pale yellow elements merge and converge at the bottom of the picture. Illusionary curves then develop orthogonally to these. In addition, you can see 3D illusions – the picture elements appear to form a curved surface. When you move the scroll bars up and down, the converging rays on the right-hand picture seem to open and close like the petals of a flower as if a zoom were involved (a new motion illusion?).
If both of the brightest colours chosen lie diagonally to each other in the colour block, the curve effect is produced when the stripes are dense enough. The small bright elements seem to form curved structures with enough contrast to their contiguous elements.
One of the most important tasks of our visual system is the separation of figure and ground (Spot 19, Spot 21); this means interpreting meaningful structures in the chaos of receptor signals. The neural network of the cerebral cortex has various tools to help us to group picture elements into figures. In the case of missing information, our brain is able to produce illusory contours (Spot 5, Spot 6 and Spot 21) and make adjustments of colour and brightness in order to simplify figure recognition. When the rapid interpretation of a figure is called for, our brain does not hesitate to come up with geometric illusions; for example, the curved structures in these pictures and the 3D effect would not occur without the assistance of the neural «generators» producing illusory contours.
In the following pair of pictures, blue and white have been swapped over. In the left-hand picture, the 3D and the curve effect have vanished, the horizontal and vertical structures dominate again and transparent stripes can be perceived, showing additional colour and brightness illusions. The red in the left-hand picture appear to be yellower and brighter, whereas the yellow appears to be more reddish and darker compared with the picture on the right.
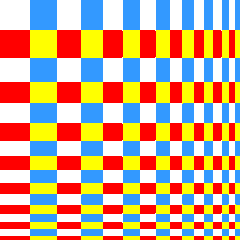
The rules for transparency are discussed in the appendix to Spot 1. The red-yellow stripes can be seen here as transparent picture elements, which cover the blue vertical stripes with the white background. The grouping in these transparent stripes is caused by the so-called T-effect, also mentioned in Spot 21. Certain nerve cells in the second visual area react to these spots with the T-effect. A T-effect can be triggered when three or four picture elements abut one another?
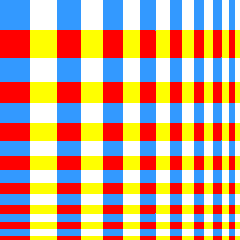
In the left-hand picture, the stem of the letter T divides the elements with the strongest contrast of brightness and the cross bar connects those with more similar grey values. If these bars fit together on a common curve, they are completed by our grey cells so that they define a figure which can be separated from the background and can seem transparent. There are no T-effects in the right-hand picture because both the lightest and darkest elements lie diagonally to each other and therefore cannot be grouped together. A more detailed explanation can be found in the appendix to Spot 1. The influence of the colours has not been fully researched to date. Observe the grey value illusions when comparing these two pictures. The grey values of the individual figure elements defined by the T-bars become attuned towards the average grey value of the whole figure (luminance effect).
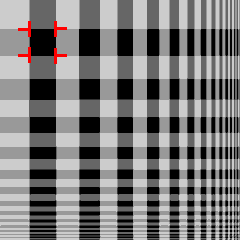
The second scroll bar of the applet can be used to change the stripes to create chaos in the regularly striped picture, which can cause visual stress and even headaches. The higher visual areas have various picture recognition tools for finding/extracting periodic structures also in the case of foreshortened perspective or other distortions. In a situation of chaos, none of these tools seems to be successful and thus hyperactivity in the brain is produced and the need for oxygen might be increased. Generally, the curve effect is missing in such chaotic pictures because the corresponding picture elements no longer lie on common curves. However, other visual effects can be observed: the colours change and the straight stripes appear to be wavy (see Bamboo Effect, picture 13 appendix to spot 1).